Version #4 Trading bands—At Incredible Low Prices
Awesome super low prices and 3 smaller “Modules”or market segments are here at Market Highs and Lows. You can take a monthly trial for just $5.00 of any market segment for 30 days. After the 30 day trial monthly prices are from $8.75 to $12.95 per market segment. The Modules are ‘Metals’ ‘Forex’ and ‘Stock indexes”. To see what each Module covers click here
http://www.markethighsandlows.com/membership-options-page/
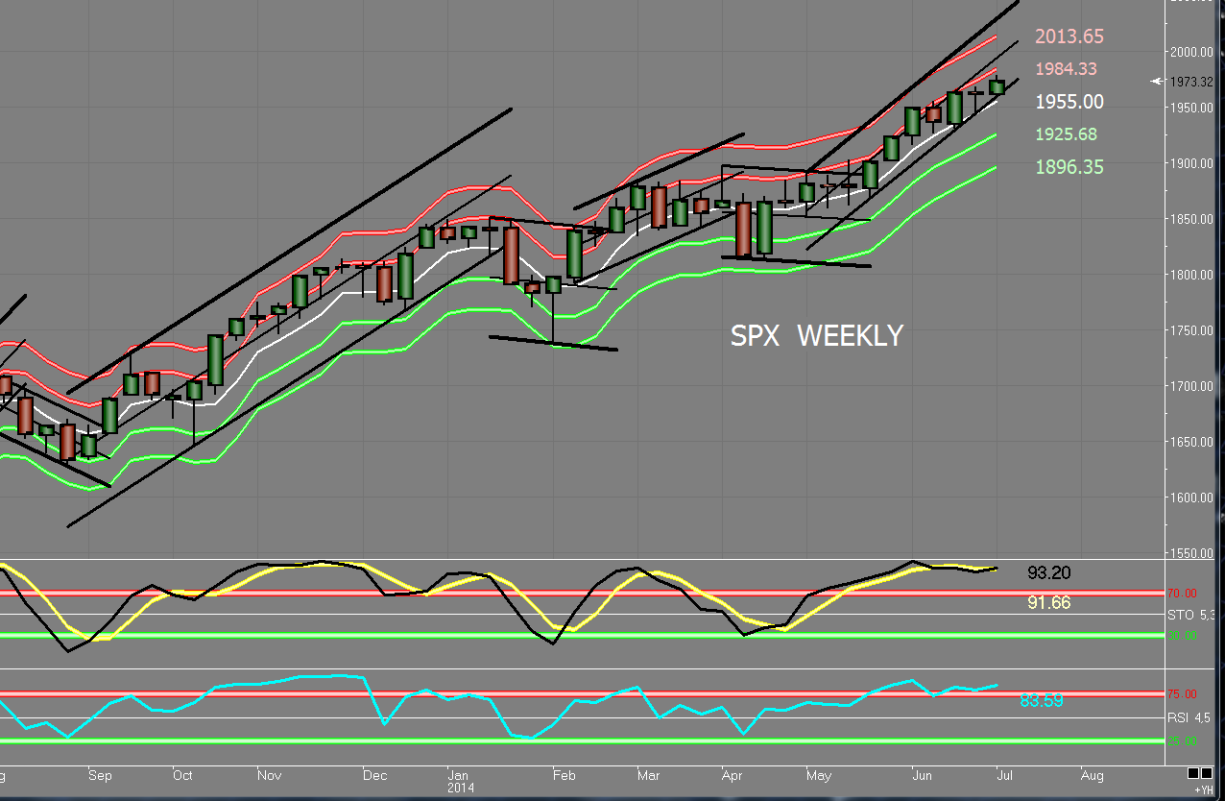
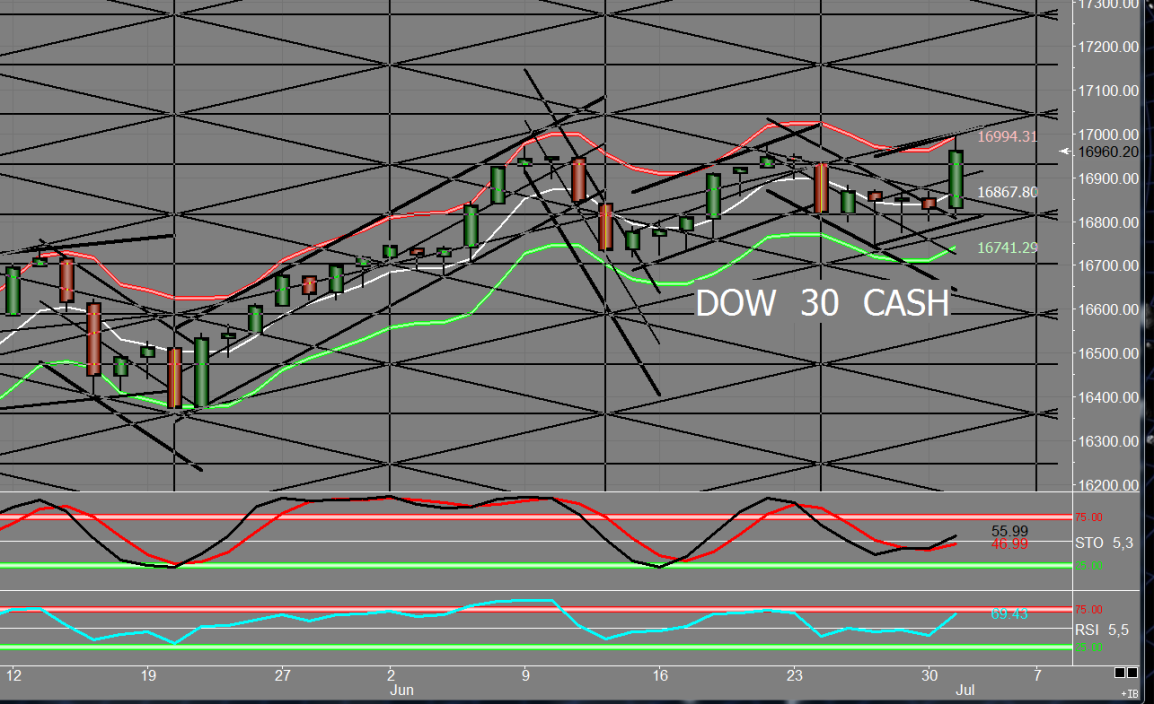
The latest Version…..#4 of the trading bands is the best yet. They are much more responsive and green bands are support and red bands are resistance and are sometimes so accurate……its hard to believe. We have added channels with the bands and when the 2 different disciplines meet the power of support and resistance is doubled. The Dow 30 Industrial chart is the only one with a Gann square that continually gives excellent CIT’s (Changes in trend). There is a new Tutorial at the Members site that explains how to use the bands. Below are 2 of my favorite charts…… the daily DOW chart with Gann Square and the weekly SPX chart. Study them carefully……
Notice how often highs and lows stop near a band. Now the bands contain 97% of the markets price action. Click on the charts for a larger size.
FREE WEEK——–SEE WHATS NEW
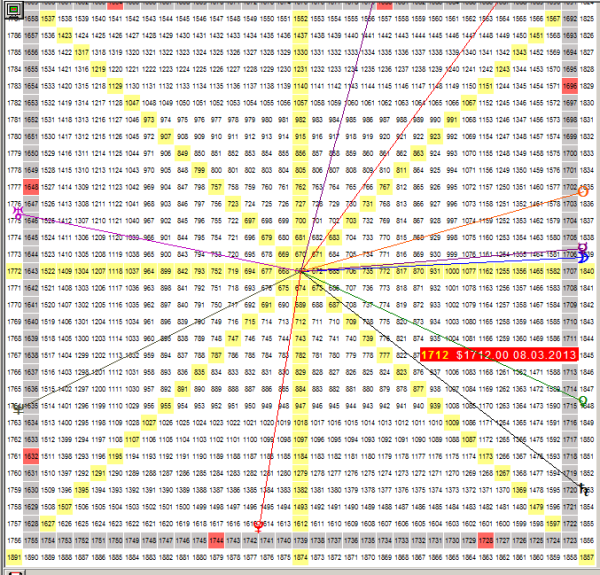
Gann Square of nine
Free Week—See how we made 300% in Bond puts last week. The CIT for Nat Gas and the New Market Map that called the rally last
week. Join us for a week and see whats new. Gann Square of nine—-planetary lines chart
Login with Username: guest Password: freesep14
www.markethighsandlows.com see “Current Update”
Special Report Has Expired
The Special Report has expired and Subscriptions have now closed.
I Believe There Is A Meltdown Right Around The Corner
New research based on WD Ganns work reveals we are likely standing on the edge of a cliff. I have found what I believe points to a severe market fall and have the data to back it up. It is happening very soon.
YOU NEED THIS INFO NOW !
It is available Friday the 28th of June
You must be a member to read this SPECIAL REPORT, The Upcoming Meltdown. Membership costs just $42 and you can sign up for just one month and cancel after that if you choose. Spend the money, read the report …and then cancel if you like. This report should save/make you a ton of money. I highlight
- The line in the sand
- Learn a few cool WD Gann techniques—worth 100 times the price of this Special Report
- An Elliott Wave count that shows the bull market is over
- An Astro correlation that is scary good and caught the May 22nd high EXACTLY
- Demographics
- Look at all the bulls
- Wall Streets scary debt
- A serious change in the weather
Now is the time to act…..you probably spend more than $42 bucks on commissions or coffee each month. I don’t care if you continue as a member….I have plenty already. Heck the Gann info alone is worth 100 times the price of the report
But you can’t afford not to read this report. I hope I’m wrong…….but I don’t think so.
This information is needed for next weeks trading.
Membership has been closed for months but is now open for this Special Report
To sign up go to http://www.markethighsandlows.com/membership-options-page/
Click the PayPal button…..This report is waiting now.
Offer Valid thru 7-1-2013 6:00 PM ET
Inverted H&S
A few charts
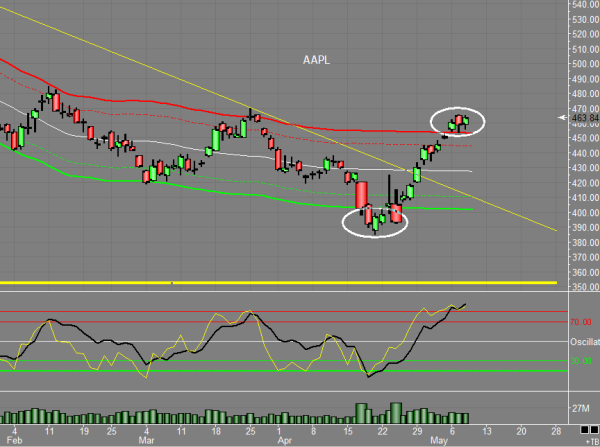
Trade update
Buying 5 AAPL May 450 puts at 5.20 for my
Personal MDC (million dollar challenge)
Started Mar 15, 2013 with $800 new value as of today 5-7-2013 $2800
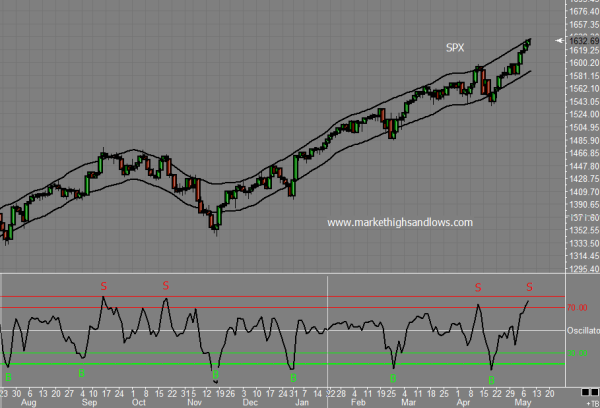
Why People Subscribe To Our Site
We are, the only place where you can see this special oscillator. Not in the tool box
of other “canned” Indicators. CLICK CHART TO ENLARGE


